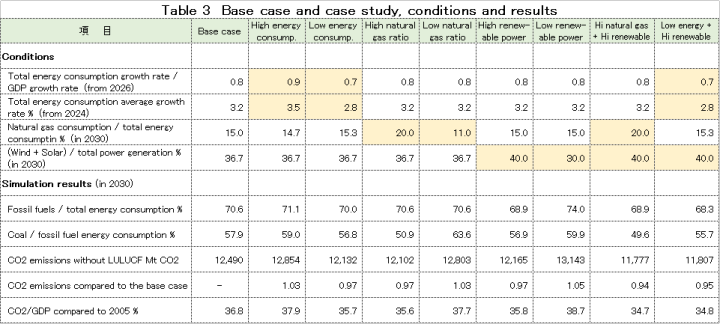
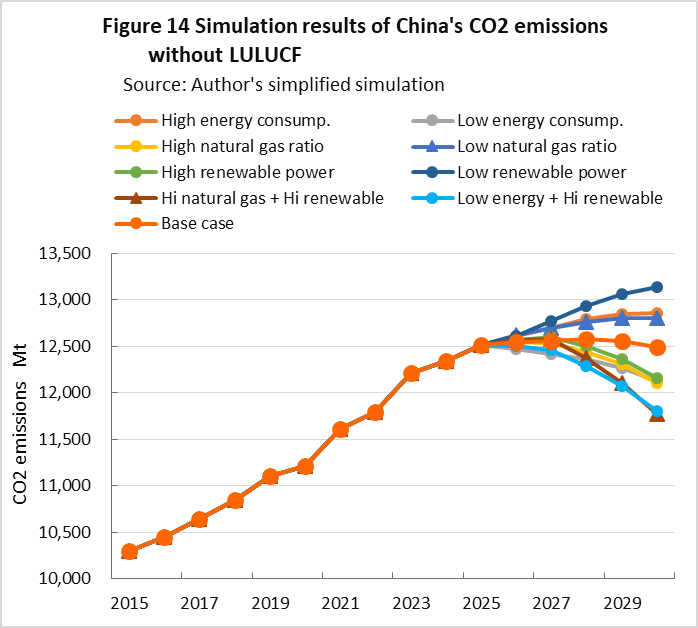
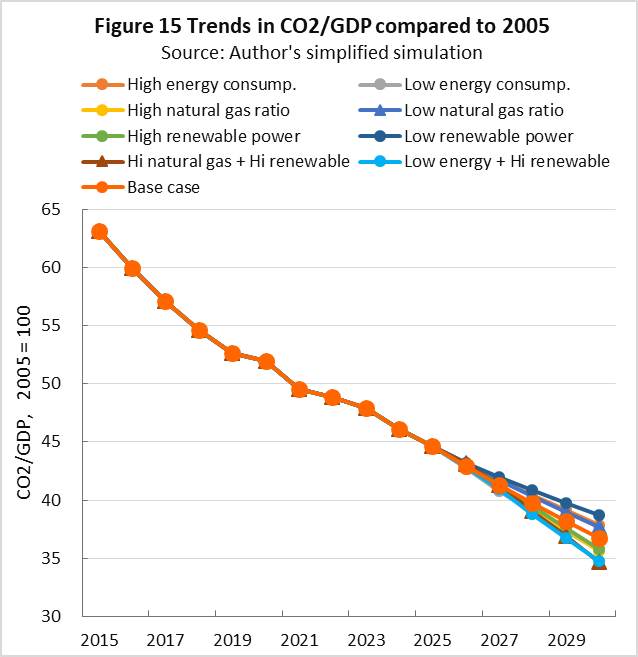
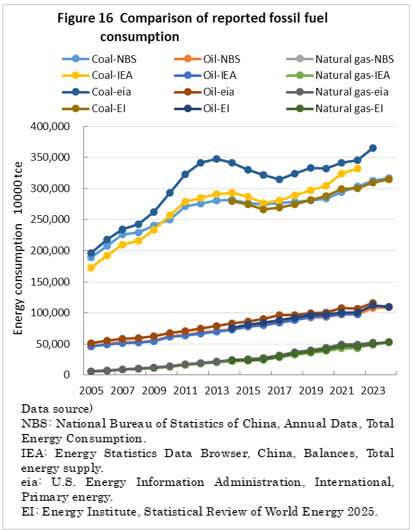
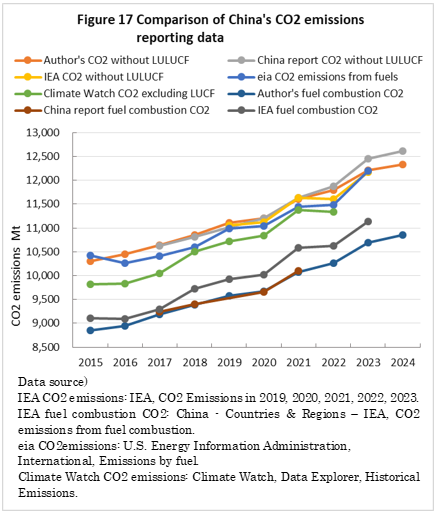
| top > global warming > China CO2 China's 2030 CO2 reduction target difficult to achieve, By: Yuzo Tanaka, Japanese Researcher Published November 8, 2025 Revised January 13, 2026 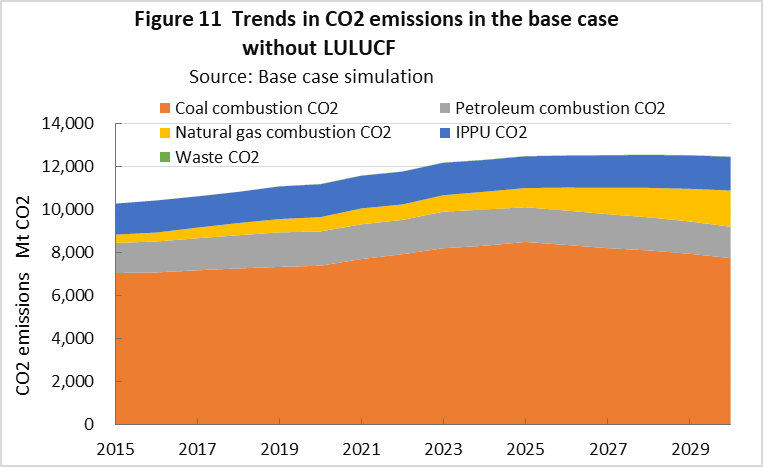 Summary Unlike developed countries, China's economic growth rate of 4-5% inevitably leads to increased energy consumption. To reduce CO2 emissions, it is necessary to implement CO2 reduction measures that offset the increase in energy consumption. Effective CO2 reduction measures by 2030 include expanding the use of renewable energy and switching from coal to natural gas. The former reduces fossil fuel consumption, while the latter leads to low-carbon energy consumption. To sustainably reduce CO2 emissions while increasing energy consumption, it is necessary to continually add new CO2 reduction measures each year to offset the increase in energy consumption. Achieving a sustainable reduction in CO2 emissions while simultaneously increasing energy consumption is more difficult than you might think. Nevertheless, peaking CO2 emissions by 2030 is a goal announced by President Xi Jinping, and therefore likely to be achieved. What is challenging is achieving the target for CO2 emissions per GDP (carbon intensity). China's 2021 updated NDC (Nationally Determined Contribution to Climate Change) states that it will reduce CO2 emissions per GDP by more than 65% from 2005 levels by 2030. This goal has become more difficult to achieve due to a larger-than-expected increase in energy consumption since the updated NDC was submitted. This paper uses a simplified simulation to examine the achievement of CO2 reduction targets by 2030. The simulation assumed future GDP growth rates and total energy consumption, and calculated CO2 emissions under conditions of increased non-fossil fuel power generation and natural gas consumption. Details are provided in the main text. According to the simulation, achieving the 2030 target will require a roughly 2.7-fold increase in the total amount of electricity generated by wind and solar power, as well as natural gas consumption, in 2030 compared to 2024 levels. Wind and solar power, whose output fluctuates depending on the weather, will account for around 40% of total electricity generation. This will require significant investment in strengthening the power transmission network by 2030, and advanced grid operation will be required to ensure a stable power supply. Furthermore, China currently relies on imports for approximately 40% of its natural gas consumption, and most of the increase will be due to increased imports. This is expected to increase China's import costs and tighten the global natural gas supply and demand situation. Main targets for climate change Table 1 shows China's updated NDC, submitted in 2021, for the Paris Agreement. It aims to peak CO2 emissions by 2030 and reduce CO2 emissions per GDP by more than 65% from 2005 levels. 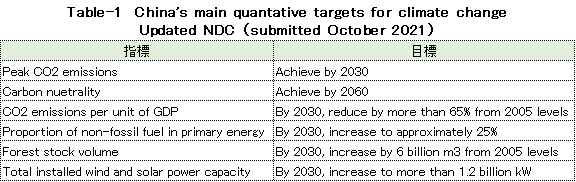 GHG and CO2 emissions To provide an overview of China's greenhouse gas (GHG) and CO2 emissions, Figures 1 and 2 show the breakdown for 2021. This data is from China's "First Biennial Transparency Report on Climate Change (December 2024)" submitted under the Paris Agreement. GHG in Figure 1 shows the breakdown of CO2, CH4, N2O, and F-gases. Emissions are expressed as the percentage of CO2 equivalents (CO2eq), excluding emissions from the land use, land-use change, and forestry (LULUCF) sector. CO2 emissions account for 81% of GHG emissions. Emissions from the LULUCF sector were minus 1,315 MtCO2eq (removals), mostly due to CO2. 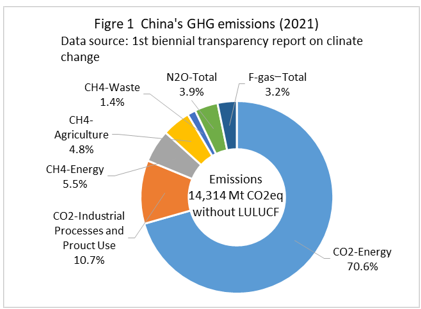 Figure 2 shows a more detailed breakdown of CO2 emissions. The numbers at the beginning of the emission source names in the figure, such as 1.A.1, are numbers specified in the GHG emissions reporting standards of the United Nations Framework Convention on Climate Change (UNFCCC), with 1.A.1 to 1.A.4 representing 1.A fuel combustion emissions, and 2.A to 2.C representing 2. industrial process and product use (IPPU) emissions. CO2 from fuel combustion accounts for 87% of total CO2 emissions. 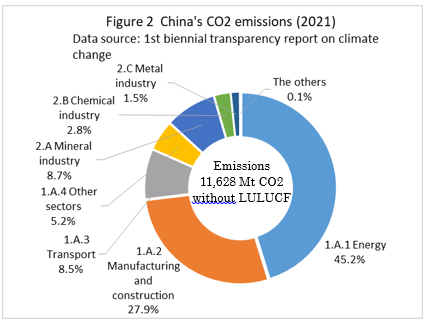 Figure 3 shows the specific product processes with high emissions instead of the industrial sector for the IPPU sector shown in Figure 2. The cement process accounts for 6.9% of total CO2 emissions, followed by lime process at 1.6%, petrochemical process at 1.4%, and ammonia process at 1.2%. 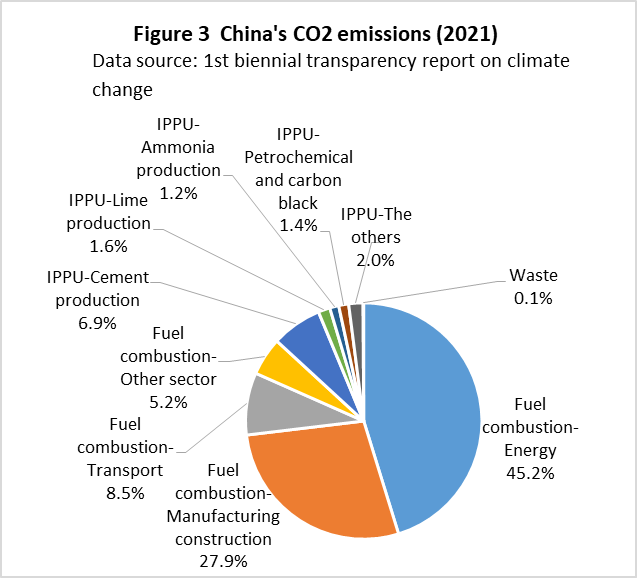 CO2 emitted from using fossil fuels as fuel is classified as fuel combustion CO2. On the other hand, CO2 derived from limestone, such as in the cement and lime production processes, and CO2 emitted from fossil fuels used as raw materials in plastics production, are classified as IPPU CO2. Figure 4 shows the trends in China's reported GHG and CO2 emissions, both with and without consideration of LULUCF. Note that 2005 is the base year for China's GHG emission reductions. The rate of increase in emissions from 2005 to 2021 is approximately 1.7 times for GHGs and approximately 1.8 times for CO2, regardless of whether LULUCF is implemented. 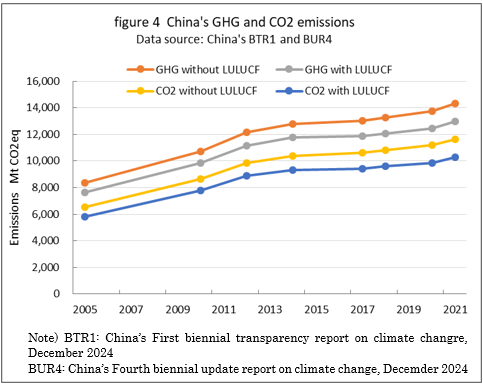 Figure 4 shows that emissions growth was slow in the mid-2010s. This is due to restrictions on coal use, particularly in small and medium-sized facilities, which were implemented as a measure to combat serious air pollution caused by coal use, thereby curbing the increase in CO2 emissions. Energy consumption data China's CO2 emissions are increasing due to increased energy consumption resulting from economic growth. Figure 5 shows the total energy consumption data reported by the National Bureau of Statistics (NBS) of China. This article uses data reported by Chinese official institutions whenever possible. 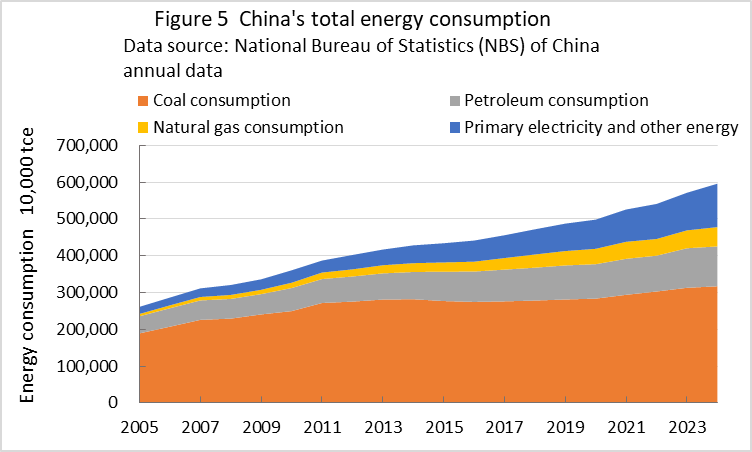 China's total energy consumption is equivalent to the International Energy Agency's (IEA) total energy supply (TES). China's total energy consumption is broken down into four categories: coal, petroleum, natural gas, and primary electricity and other energy. The energy unit generally used is the standard ton of coal equivalent (tce), which is converted at 1 tce = 7 Gcal. Note that this is slightly different from the calorific value of steam coal. This likely reflects the country's large domestic production of coal as its primary fuel. "Primary electricity and other energy" refers to energy sources other than fossil fuels. Within this, "primary electricity" represents the amount of electricity generated by nuclear, hydroelectric, wind, and solar power, expressed as the input energy required for coal-fired power generation. This calculation uses the average generating efficiency of coal-fired power plants; for example, the generating efficiency (Gross) of coal-fired power plants in 2022 is estimated to be 42.8%. Note that "other energy" within "primary electricity and other energy" appears to refer to renewable energy consumption other than electricity. However, in this article, this is the remainder after subtracting the calculated value of primary electricity from the statistical data for "primary electricity and other energy," and accounts for approximately 2% of total energy consumption. The proportion of coal consumption has been steadily declining, but still accounts for 53% of total energy consumption and 66% of fossil fuel consumption in 2024. CO2 reduction measures Measures for reducing CO2 emissions include reducing energy consumption (energy conservation), reducing CO2 emissions per unit of energy consumed (low-carbonization), and CO2 capture and storage (CCS). Power storage and hydrogen energy are primarily intended to effectively utilize surplus electricity from wind and solar power with variable output, and full-scale implementation is still some way off. CCS is likely even further in the future. Furthermore, energy conservation efforts have been ongoing, making it difficult to significantly increase energy conservation by 2030. However, these CO2 reduction measures cannot be expanded indefinitely. Because the output of wind and solar power generation fluctuates depending on the weather, it is essential to have measures in place to respond to power shortages and to make effective use of surplus electricity. Furthermore, while China places importance on maintaining energy self-sufficiency, it currently relies on imports for around 40% of its natural gas consumption, and an increase in natural gas production will lead to an increase in import costs. Simplified simulation The author's simplified simulation aggregates fuel combustion CO2, which accounts for approximately 87%, industrial process and product (IPPU) CO2, which accounts for approximately 12%, waste CO2, which accounts for approximately 0.1%, and CO2 removals in the LULUCF sector The only intentional reductions being considered regarding future CO2 emissions are those from fuel combustion; other CO2 emissions and removals are estimates based on future trends. Note that CO2 emissions from the waste sector are small, and the rate of increase in CO2 removals in the LULUCF sector is small, so these assumptions are based on past trends. Calculation of CO2 from fuel combustion Taking into account the uncertainty of related energy data, etc., I decided to use the CO2 emissions figures for the base year of 2005 reported by China to the United Nations Framework Convention on Climate Change (UNFCCC). The calculation of CO2 emissions from fuel combustion from 2015 to 2024 was calculated by excluding "non-energy use" and "coal washing and dressing losses" from the energy consumption figures for coal, oil, and natural gas for China as reported by the National Bureau of Statistics, and integrating them using CO2 emission factors. As no reports were found by Chinese agencies on non-energy use, I used the proportions of the same data shown in the IEA energy balance. Coal washing and beneficiation losses are considered to be included in the total energy consumption of the National Bureau of Statistics, but are excluded because they do not contribute to CO2 emissions. The figures are based on the ratios from the National Bureau of Statistics' coal balance sheet, and the ratio to coal consumption varies from year to year, but accounts for 1-5%. The carbon content of coal, oil, and natural gas related to the CO2 emission factors was set to the default values for bituminous coal, crude oil, and natural gas given in the 2006 IPCC Guidelines on GHG emissions, and the carbon oxidation factor was set to the default value of 1. The energy consumption and power generation amounts for 2025 were based on the forecasts listed below. Power generation amounts are assumed based on the power generation capacity forecast. China Energy Transformation Program (CET), Summary of China's energy and power sector statistics in 2024 The simulation for 2026 and beyond follows the approach to reducing CO2 emissions mentioned above, focusing on predicting the reduction of coal consumption, the largest source of CO2 emissions, through the expansion of wind and solar power generation and a shift from coal to natural gas. An overview is provided below. First, the increase in total energy consumption due to future economic growth is assumed. As efforts have been made to reduce energy consumption up until now, I believe that this trend will not change significantly between now and 2030, and we have based our assumptions on past trends, as described below. In the base case of the simulation, wind and solar power generation was assumed based on the installed capacity forecasts from the China Wind Energy Association (CWEA) and the China Photovoltaic Industry Association (CPIA), which are considered to be in line with the 2030 CO2 reduction target. The shift from coal to natural gas is somewhat slow, with natural gas accounting for 8.8% of total energy consumption in 2024. However, based on the guidelines in the Energy Production and Consumption Revolution Strategy (2016-2030) issued in 2016, I assume that this will increase to 15% by 2030. Other energy quantities are assumed to be the same in both the base case and the case study. China's oil consumption growth is declining, and the IEA's "Oil 2025" forecast assumes that it will peak in 2028, so this forecast was used. The growth rates for nuclear and hydroelectric power generation are relatively small, set at 4% and 2% annually, respectively, based on historical trends. These factors determine the amount of "primary electricity" consumed, which is part of the aforementioned "primary electricity and other energy" consumption. Note that because the proportion of "other energy" is small, I assumed it would grow at a constant rate, the same as past trends. Coal energy consumption is calculated as the remainder after subtracting oil, natural gas, primary electricity and other energy from total energy consumption. The ratios of "non-energy use" and "coal washing and dressing losses" to fossil fuel energy consumption are assumed based on past trends, and CO2 emissions are calculated using the same CO2 emission coefficient as up to 2024. Total energy consumption, which is a factor in the increase in CO2 emissions, was assumed to be as follows. Figure 6 shows the growth rates of total energy consumption and total power generation relative to the GDP growth rate. The figures up to 2024 are actual values, and from that point onwards, the values used are those from the base case of the simulation. 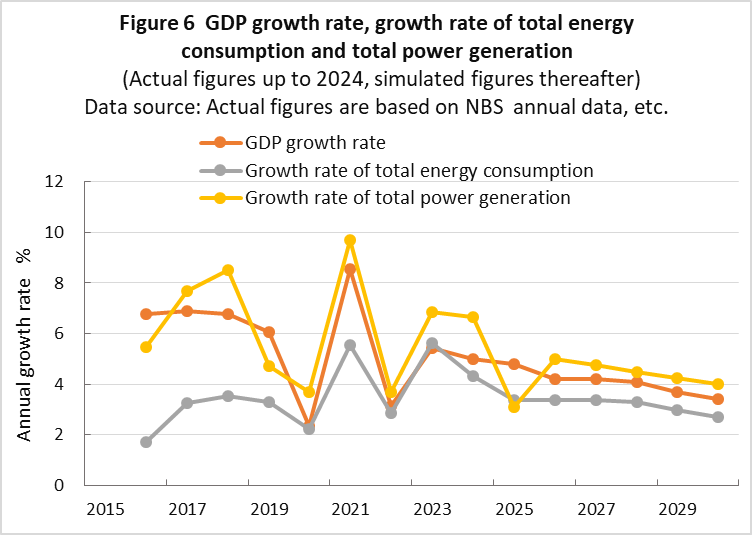 Although the graph has fluctuated significantly due to the economic downturn caused by COVID-19, I believe there is a correlation between GDP and actual energy consumption. In the base case of the simplified simulation, the annual growth rate of total energy consumption is assumed to be 0.8 times the GDP growth rate. The average annual growth rate of total energy consumption from 2025 to 2030 is approximately 3.2%. In addition, case studies were shown where the annual growth rate of total energy consumption was set to 0.7 and 0.9 times the GDP growth rate. IPPU sector CO2 calculation CO2 emissions in the IPPU sector are calculated by dividing them into five sectors shown in Figure 3: cement, lime, ammonia, petrochemicals, and others. As CO2 emissions from the IPPU sector are relatively small at approximately 13% of the total, CO2 emissions were estimated based on the assumption that they are proportional to the production volume of each sector, based on the most recent data officially reported by China for 2020 and 2021. For the petrochemical sector, the evaluation was based on the production volumes of ethylene and methanol as representative products. Figure 7 shows the trend in production volume, with 2015 production volume set at 100. It is difficult to predict production volumes beyond 2025 for cement and petrochemicals, which have seen large fluctuations in production volumes in recent years. Production volumes for other sectors have been estimated based on past trends. 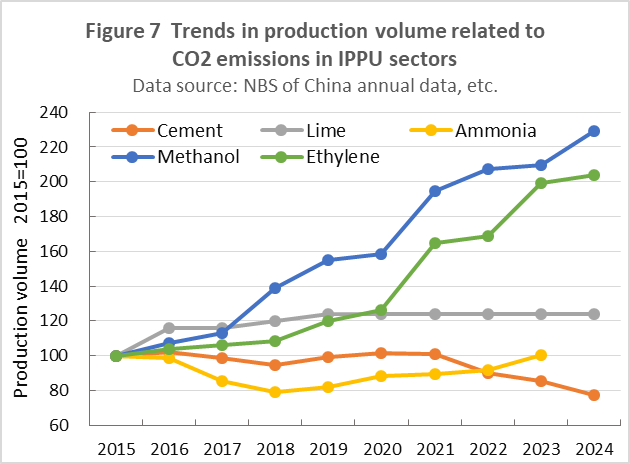 In Figure 7, cement production began to decline from 2021 onwards due to the collapse of China's real estate bubble. The real estate recession is serious, and it is thought that it will take a considerable amount of time to resolve. The rapid increase in production of ethylene and methanol, the major intermediate products in the petrochemical sector, is due to oil-related companies expanding their production facilities in the petrochemical sector to compensate for the decline in oil consumption in the transportation sector. China is the world's largest producer of petrochemicals, and production is expected to continue to increase in the future, which in turn is expected to lead to a continued increase in CO2 emissions. Base case simulation results The base case aims to peak CO2 emissions in 2030 and reduce CO2 emissions per GDP by more than 65% compared to 2005 levels. Table 2 shows a comparison of the actual results in 2024 and the projected values in 2030 for the main items in the base case. 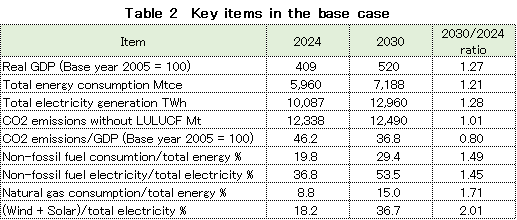 Total energy consumption, which is a factor in the increase in CO2 emissions, is expected to increase by approximately 1.2 times in 2030 compared to 2024, with an average annual growth rate of 3.2%. The ratio of natural gas to total energy consumption is set to increase from approximately 9% in 2024 to 15% in 2030. Although not shown, the ratio of natural gas consumption in 2024 and 2030 is approximately double. In addition, the ratio of wind and solar power generation to total power generation is set to double from approximately 18% in 2024 to approximately 37% in 2030, meaning that the ratio of total power generation from wind and solar power generation will be 2.6 times higher in 2030 than in 2024. As a result, the proportion of non-fossil fuel consumption in total energy consumption will increase from approximately 20% in 2024 to approximately 29% in 2030, and the proportion of non-fossil fuel power generation in total electricity generation will increase from approximately 37% in 2024 to approximately 54% in 2030. As a result, even though energy consumption will increase by 1.2 times, CO2 emissions in 2030 will remain roughly the same as in 2024. In order to curb the increase in CO2 emissions even if energy consumption increases by about 3% per year, it will be necessary to significantly expand wind and solar power generation and switch from coal to natural gas. Nevertheless, the simulated CO2/GDP ratio for 2030 is 36.7% compared to 2005, which is still short of the revised NDC target of 35%. This will be addressed in the case study. Figures 8 and 9 show the energy consumption results of the simulation, Figure 10 shows the amount of power generated, and Figure 11 shows the trends in CO2 emissions. Figures up to 2024 are actual results, and figures thereafter are estimated values. 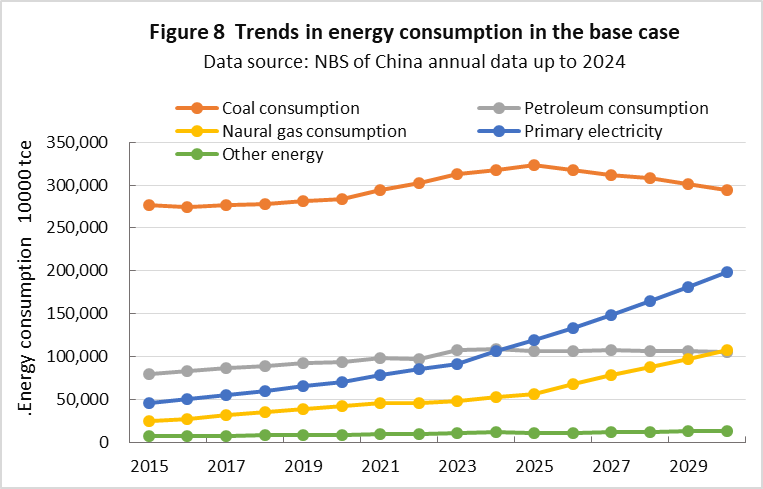 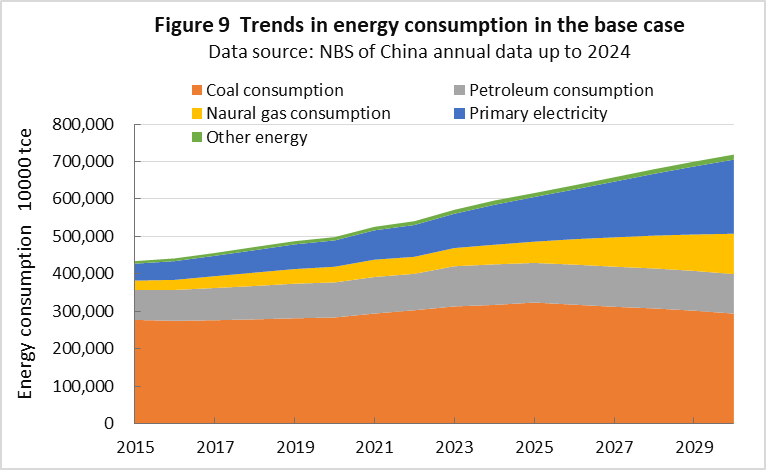 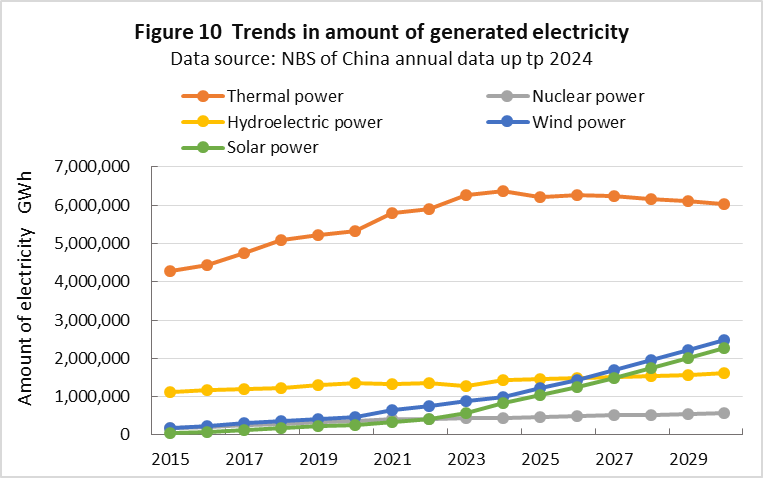 You can see that it is expected that non-fossil fuel consumption and electricity generated by wind and solar power will increase sharply from around 2024. As shown in Figure 11, CO2 emissions will remain roughly constant from 2025 onwards, and although the peak is unclear, the calculated value peaks in 2028. After that, emissions will decrease slightly, and by 2030 will be just under 1% below the peak value. Each year's CO2 emissions are determined by the conditions set for that year, and are not affected by past trends. Comparison with China's reported CO2 emissions China reports its GHG emissions to the UNFCCC every two years, and has reported emissions up to 2021, as shown in Figure 4. In addition, the National Bureau of Statistics of China reports a preliminary assessment of the year-on-year reduction rate of CO2/GDP in February of the following year. This data can also be used to calculate annual CO2 emissions. These are the CO2 emissions figures reported by China, and are shown in Figure 12 in comparison with the results of the base case simulation. 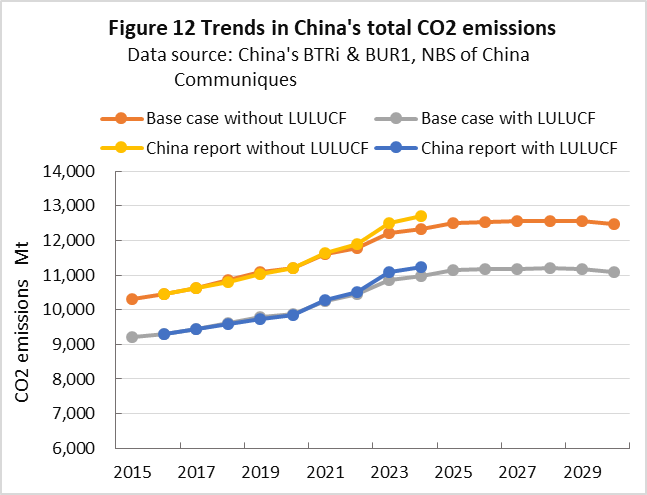 The simulation results of CO2 emissions up to 2022, calculated using actual data such as fossil fuel consumption, are in good agreement with the Chinese report. The simulation results for 2023 and 2024 are 2-3% lower than the Chinese report. The discrepancy is thought to be due to differences in the calculation of CO2 emissions in the IPUU sector and in the assumptions about non-energy use within energy consumption, but the exact cause cannot be identified. However, as this is a simplified simulation, differences of this magnitude are to be expected. Figure 13 shows a comparison of CO2/GDP reduction targets, with the base year of 2005 set at 100.  As with Figure 12, the simulation results for 2023 and 2024 are about 1 percentage point lower than the China report. I believe that the simulation results for CO2/GDP in 2030 may also be lower. Case study The case study provides an indication of how much CO2 emissions and the CO2/GDP ratio would change by changing total energy consumption, the proportion of natural gas, and the proportion of wind and solar power generation. The forecasts for 2025 follow the China CET report, but the base case settings for 2026 and beyond are changed to the following eight cases. - Year-on-year growth rate of total energy consumption: GDP growth rate x 0.9 (high energy consumption case), GDP growth rate x 0.7 (low energy consumption case) - Natural gas ratio in total energy consumption in 2030: 20% (high natural gas ratio case), 11% (low natural gas ratio case) - Wind and solar power ratio in total power generation in 2030: 40% (high renewable energy generation case), 30% (low renewable energy generation case) Furthermore, the following cases are included for CO2/GDP in 2030, where the reduction target of 35% is exceeded: - High natural gas + high renewable energy generation case - Low energy consumption + high renewable energy generation case Table 3 shows the set values for each case and the values for the main items in 2030. Note that if the growth rate of total energy consumption is changed, the natural gas ratio will also change in the simulation calculations.
Figure 14 shows the trends in CO2 emissions
for eight cases compared to the base case. The top three cases are cases where
emissions have not peaked by 2030. |